Introduction to FlySight
/By Andrew Swint
Contents of this Article
What is a FlySight?
What is it used for?
About the Device
Connecting for Setup
Paralog Performance Competition Files
Wide Open Wingsuit Series (WOWS) Files
Mounting the FlySight
At the DZ: Connecting to Satellites
At the DZ: 10 Minute Call
Viewing Your Data
Data Example
Zooming In On Data
Scoring a PPC Run
Always More To Learn!
What is a FlySight?
A FlySight is a GPS device that uses multiple satellite signals to log information about human flight using 3D positioning. The FlySight has two main functions:
1. It transmits flight information to the jumper in real time, during flight, via headphones;
2. It logs data for future analysis after flights.
The FlySight is not marketed for, and should not be used as, an altimeter.
What is it used for?
The information gathered by the FlySight can be useful for matching vertical and horizontal speeds in both wingsuit flocking and XRW. Listening to the real-time feedback during flight and analyzing logged data is also useful for those interested in training for and participating in performance competitions. But before we get too deep into different uses, let's go over the FlySight itself and how to get it set up.
About the Device
The FlySight has one light located on the front, one switch on the bottom, and one headphone jack on the bottom.
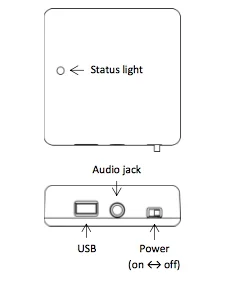
Labeled components of the FlySight (described below) as seen on the FlySight Quick Start Guide.
The light shows what mode the FlySight is in:
- “Solid red” = the device is charging;
- “Flickering red” = connected to a computer;
- “Solid green” = the GPS is looking for satellites;
- “Flashing green” = the GPS has acquired satellites and is ready to perform properly.
The switch has two functions:
1. The basic one, of course, is that it turns the device on and off.
2. By turning the device on-off-on in rapid succession, your FlySight will start saying file names. These are the different configurations found in your Config file (discussed later in this article).
You will use the second function to change the real time feedback (what you are listening to on your flight), depending on what type of performance flight you are doing.
If this feature is not used, the FlySight will default to the CONFIG.TXT file located outside the Config folder.
The headphone jack is used for plugging in head phones and routing them into your helmet, where they can provide real time audio feedback during flight. The last part of the FlySight is the USB port. The port uses a USB mini-b cable to charge your FlySight and connect it to your computer.
Connecting for Setup
Before heading out to the dropzone the firmware on the FlySight needs to be updated. To update the firmware click here and follow the instructions for your operating system.
While your FlySight is connected, set up your Config folder. The Config folder is where you are going to put different configurations for different real time feedback and alarms depending on the type of jump you are doing.
Note: The configuration file you select for any given jump will have no effect on the data recorded on the FlySight. This only effects the real time information being fed to you through your headphones.
Paralog Performance Competition Files
The most common are Paralog Performance Competition (PPC)-style race files, which cover the common PPC tasks of flying for speed, distance, and time. The USPA National Championships presently use this format. Below are downloadable files you can use.
Wide Open Wingsuit Series (WOWS) Files
With the Wide Open Wingsuit Series (WOWS) growing in popularity, most competitive pilots now have additional configuration files for common WOWS tasks such as WOWS speed and WOWS distance. If you plan on listening to them, I highly recommend you study them so you know what you are listening to and why. As you become more experienced and get more coaching, you will find what you like and make adjustments to these files or create your own. Click below to download.
Changing the Dropzone Elevation
The above files are a good starting point, but by no means the final product. One modification you will have to make to any configuration file you plan to use is the "DZ_Elev" (dropzone elevation) setting. This is found near the bottom of the txt file and must be set to the dropzone elevation where you plan to jump in meters above sea level. This setting needs to be changed on any configuration file you plan to use, every time you jump at a different dropzone. To change it simply delete the number that is there (i.e. on my files, downloadable above, it is Skydive Elsinore at 382 meters) and replace the number with the new value.
Mounting the FlySight
Now it’s time to mount your FlySight. You can put the FlySight in a pocket or in the wing of your suit, but most mount it to a helmet. For best results, mount your FlySight to the back of your helmet where it will have a clear line of sight to the satellites. Mounts made for different helmets can be found online or at your local gear shop. I have also seen plenty of people get creative with gaffers' tape!
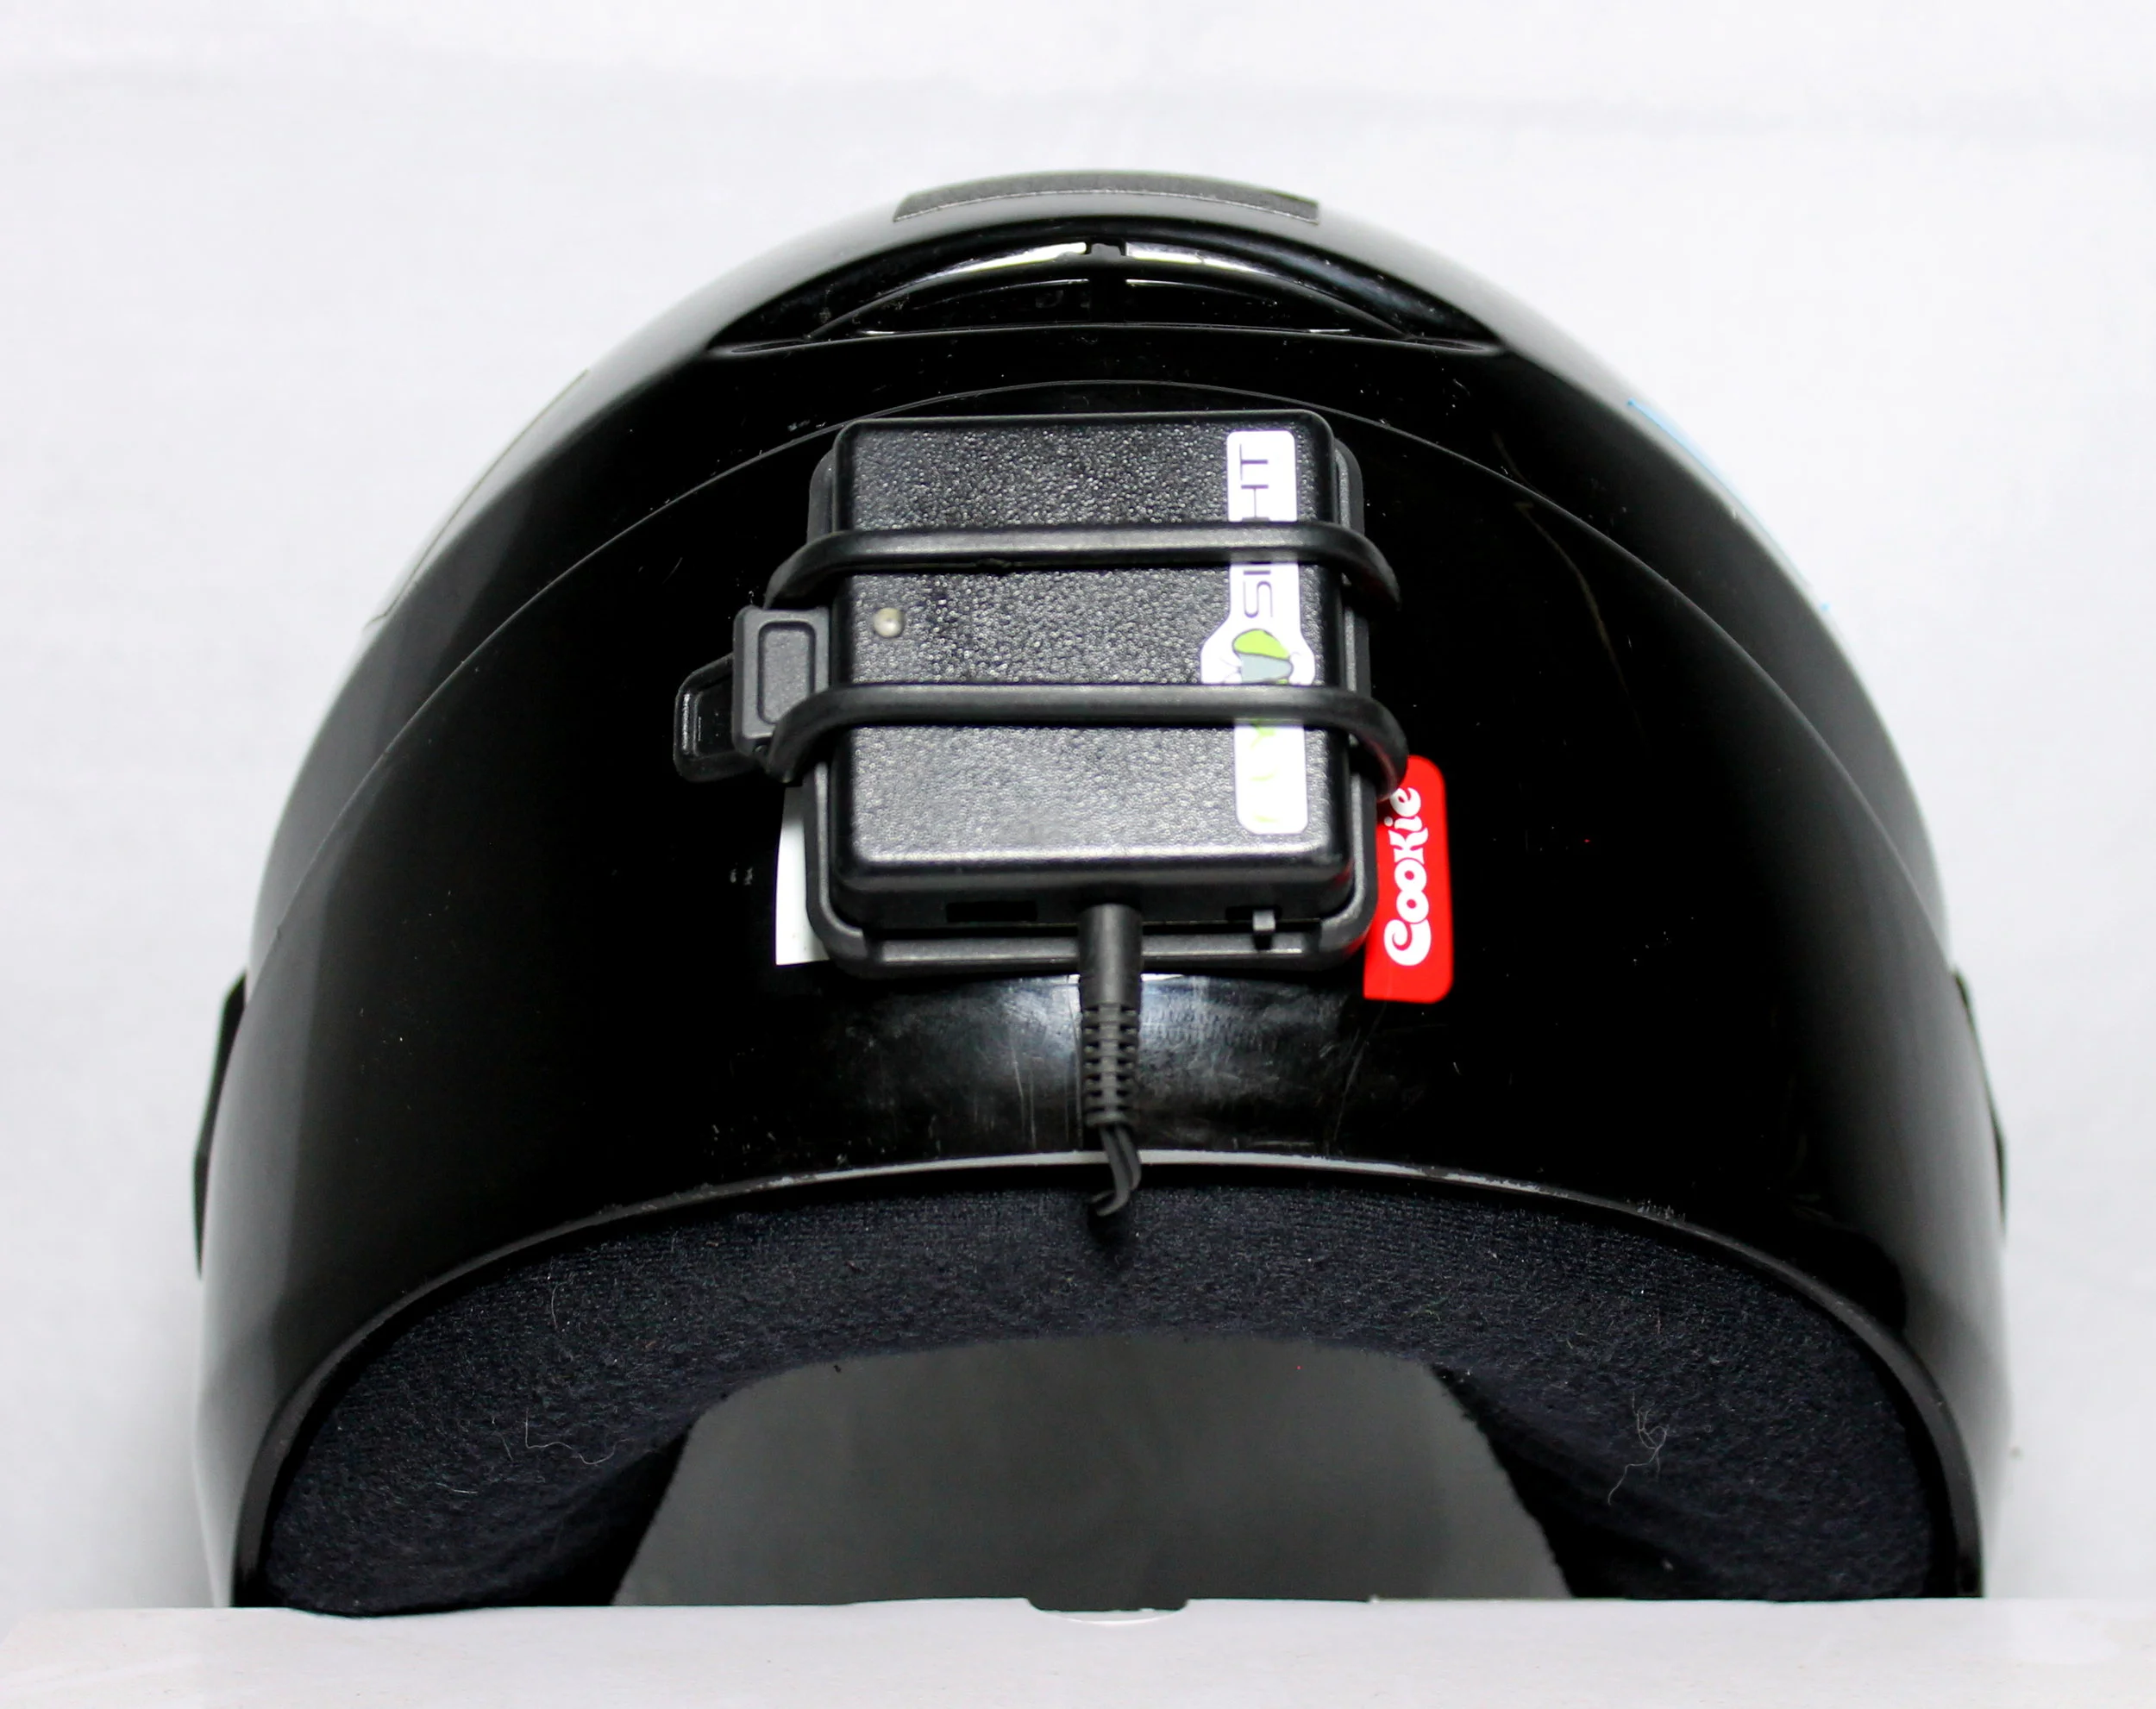
No matter where you mount your FlySight, you want to make sure you can get your headphones from your FlySight to your ears. The image below shows how I have mounted my FlySight and how I have routed my headphones. I choose to only listen with one ear. This allows me to listen to changes in wind speed while I fly and hear my audible altimeter.
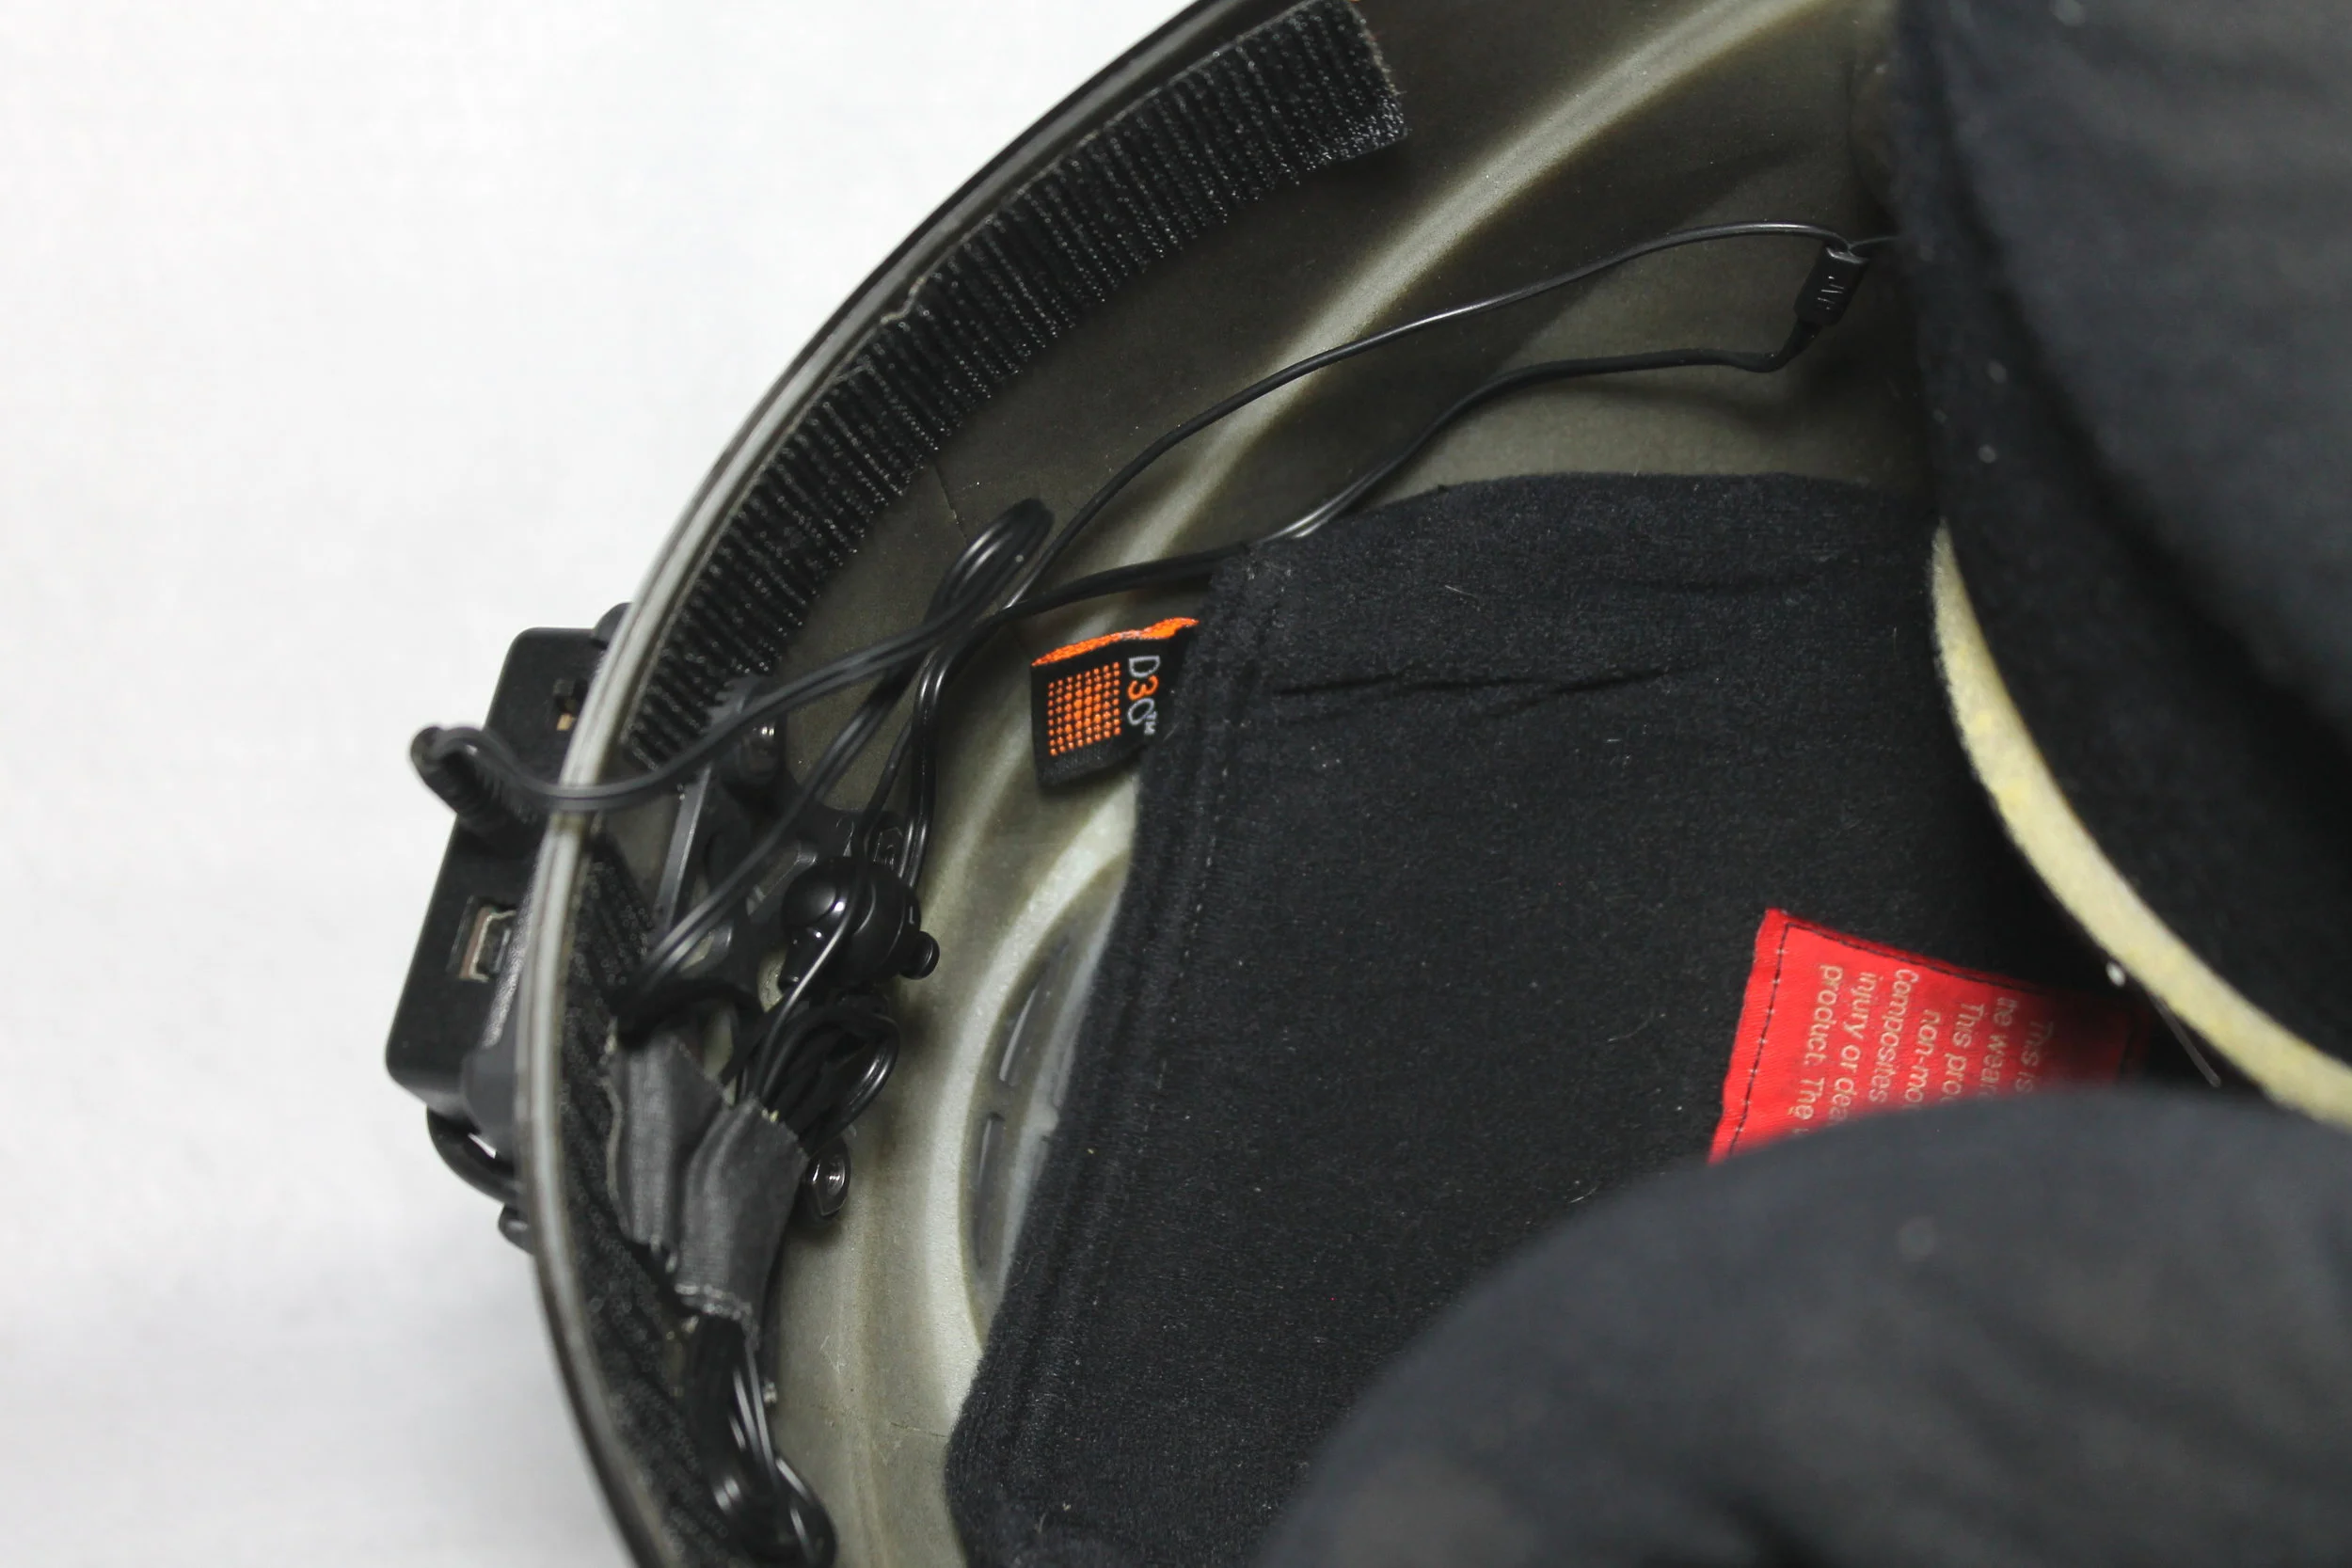
The padding is pulled back to show how the headphone is routed from the back of the helmet where the excess is secured to the hole in the padding on the right side of my helmet for the audible.
At the DZ: Connecting to Satellites
When you first arrive at the DZ, the GPS needs to connect to the satellites in the area. To accomplish this, turn it on and place it outside with clear sky above it for at least 15 minutes. When you first turn it on, you will see the solid green light. Once the device is done with the 15 minute warmup period you should see the green light flashing. You can now turn your FlySight off until you are ready to fly. If the light is not flashing, leave it and continue to let it connect.
At the DZ: 10 Minute Call
When getting ready to jump, turn the FlySight on for a minute or two before boarding the plane. The official instructions state to turn it off for the ride to altitude and then turn it back on a minute or two before exiting. Personally, I turn it on before getting on the plane and leave it on for the ride up and the jump. Turning the FlySight off after boarding the plane then on again before jumping saves on battery and makes the file smaller when going to view it on your computer. However, very rarely, the FlySight struggles to reconnect to satellites in the minute or two before exiting the plane. I prefer to keep it on during the climb to altitude to ensure that I stay connected. There are pros and cons to both methods, it just comes down to preference. A very important part of this is to wait until you land to turn your FlySight off.
If you turn your FlySight off under canopy the data will not be logged correctly. Turn your FlySight off after landing on the ground!
Viewing Your Data
To view data logged during your flight, plug your FlySight into your computer and open the FlySight viewer.
Click the “File” button, then “Import Track” and select the last/most recent file created. There is a file created every time you turn your FlySight on so make sure you are looking at your flight and not the warm up period from that morning. Your flight will be the last file created and usually the largest file. This will bring up the graph with your flight track and a number of lines on the graph showing different aspects of the flight.
Data Example
Below you will see an example of one of my flights from the 2017 USPA Wingsuit Performance National Championship.
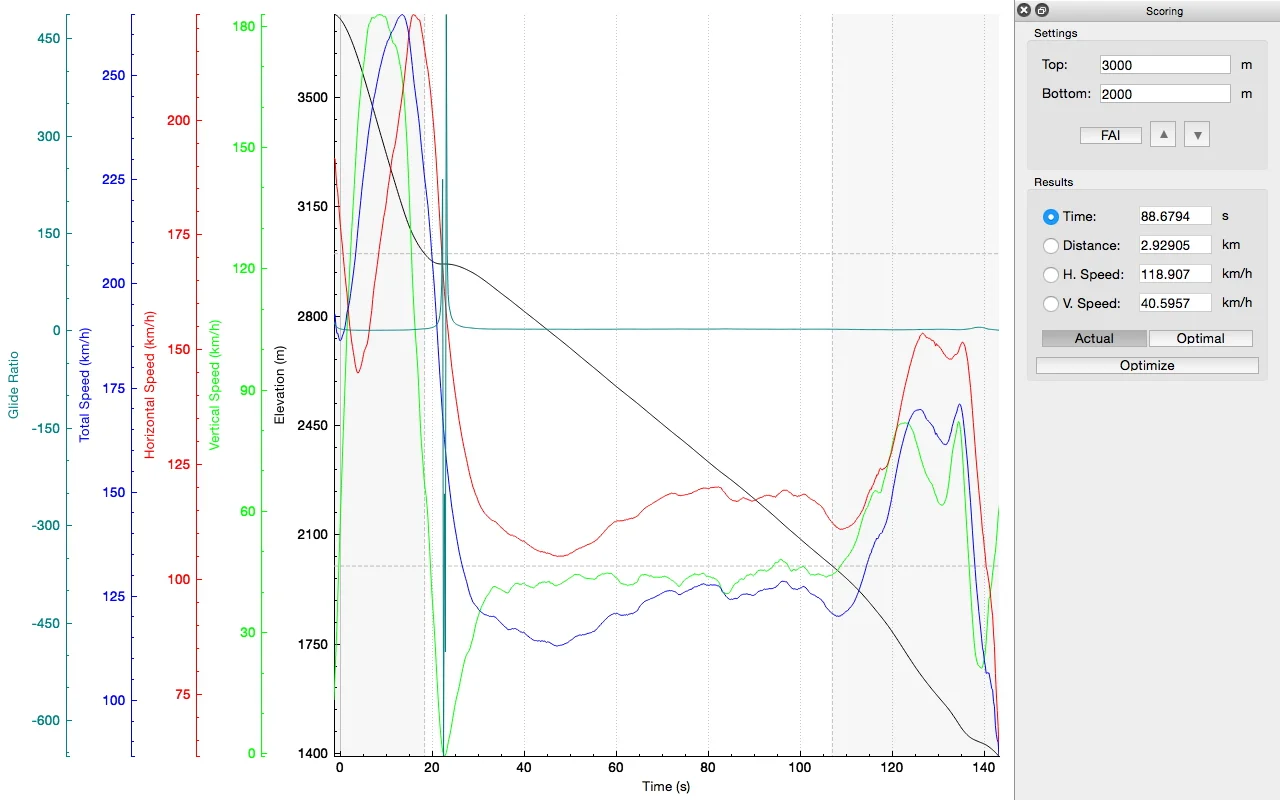
2017 USPA National Wingsuit Performance Championship round 1 time run flying a Squirrel CR+ zoomed in to wingsuit flight only and exit set (explained below)
The above graph shows a time run (zoomed in to just the wingsuit flight, with the plane ride to altitude and canopy flight omitted). The objective of a time run is to stay in the performance window (3000m-2000m) for as long as possible. In a basic sense this is accomplished by achieving the lowest vertical speed possible (lime green line on the graph) through the window.
During flight, I’m listening to vertical speed as my real-time feedback. Though this is important for adjustments during flight, the real benefit is training and reading the data after the flight to find the best flight techniques and flight configurations suited for the task you are trying to accomplish.
The graph is set up by default with time as the x axis (the horizontal line along the bottom of the screen), and altitude as the y axis (the vertical line along the left). In FlySight viewer, under the “Left” button at the top of the screen, you will find options of what information will be shown on the graph. Besides the black line, which shows altitude, I always have the data shown above as my default view, which is glide ratio (dark green), total speed (blue), vertical speed (lime green), and horizontal speed (red). There are other options but this will give you a great start.
Zooming In On Data
Depending on when you turned your FlySight on you first open your file you will see a graph that looks something like this:
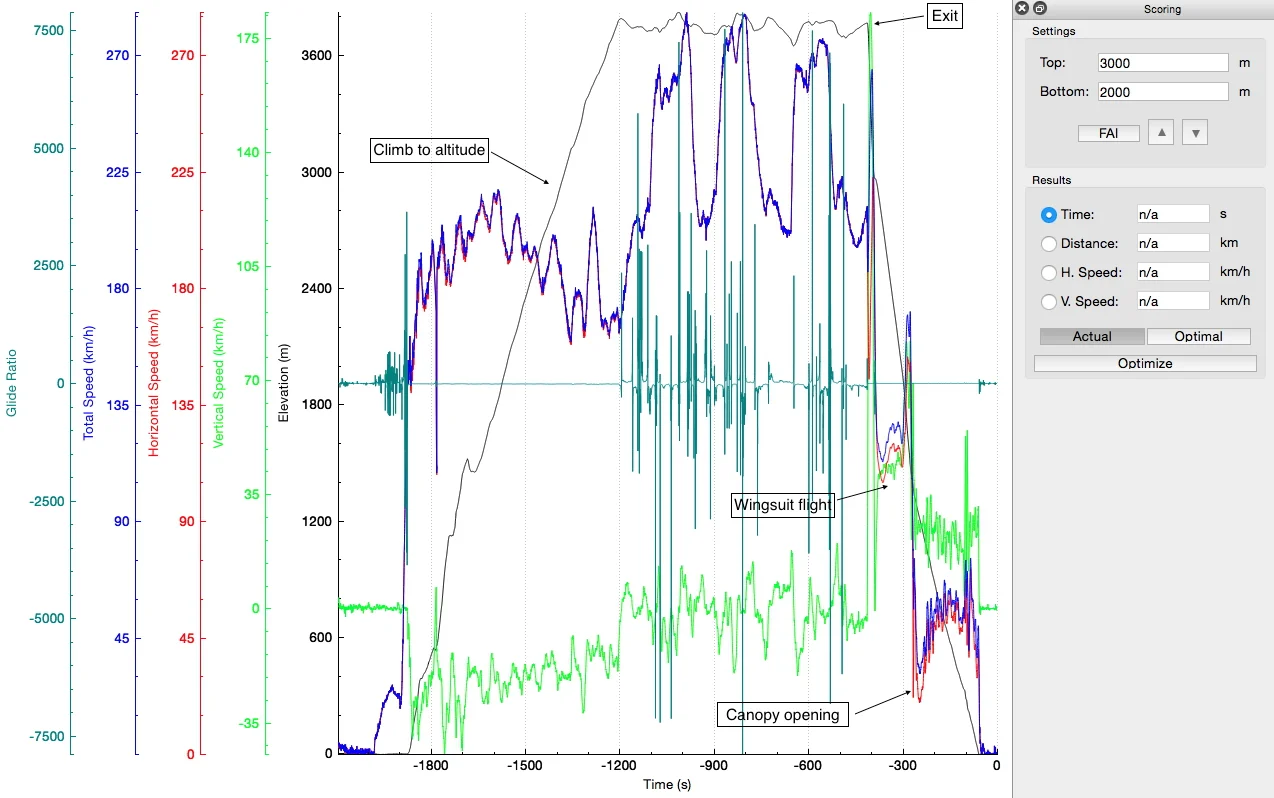
This is the same track as the one above, prior to zooming into the wingsuit flight: i.e. with the FlySight on from before boarding the plane through landing on the ground. The FlySight track is labeled to point out key areas. All tracks look different but these components should always look similar to this.
Follow the black line until you find an aggressive descent (labeled above) that continues to the ground. Go to the “Tools” button at the top of your screen and select “Zoom”. Click the beginning of that descent with your mouse and drag to the end of the wingsuit flight. We can find the end of the wingsuit flight by identifying the opening of the canopy, which is shown on the graph as a drastic drop in both horizontal speed and total speed (labeled above).
I personally zoom in a few times. The first time is getting me close:
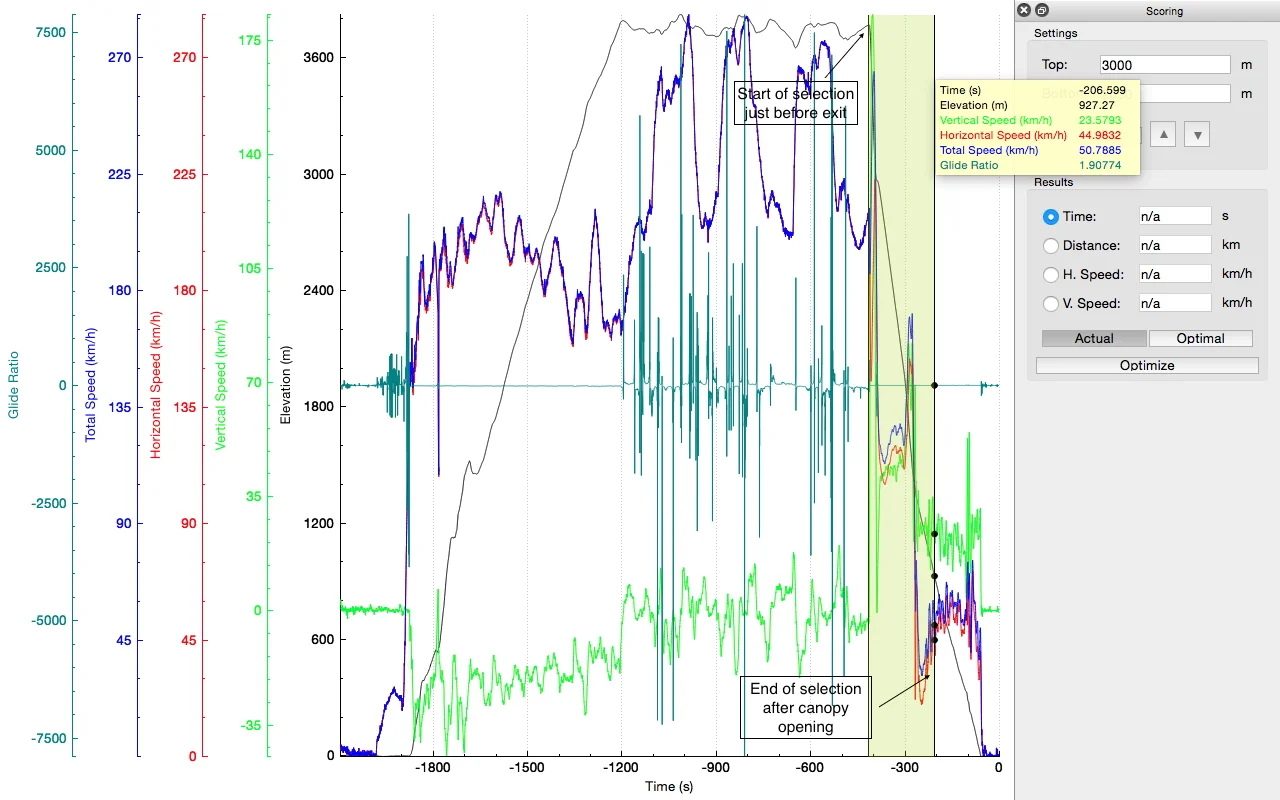
The second zoom is more specifically on the information I know is my wingsuit flight:
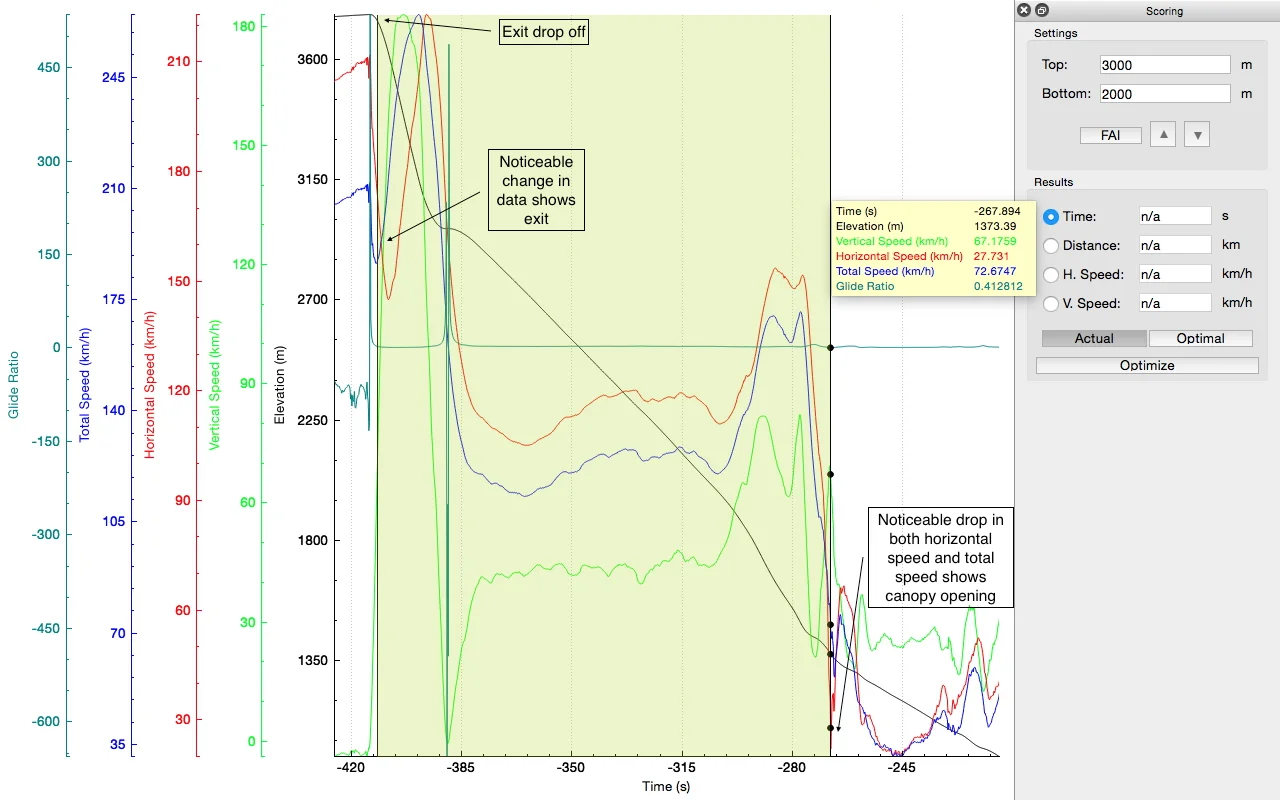
You can use your mouse to scroll across the graph and a yellow box will appear showing the specific information at the point your cursor is at. An example of this can be seen below. The point I am showing is around the middle of the window where I would check the various data shown to see if I can decrease my vertical speed any further to give me more time window.

Using the mouse to scroll across the tack to find the lowest vertical speed of my flight.
Scoring a PPC Run
For a PPC style run such as the example above, the program will automatically score the run for you if configured properly. At the top of your screen click “Window” button and select “Scoring”. This will bring up a scoring bar at the bottom of your screen. It can be dragged and moved. I have my scoring bar on the right, which I feel gives me the best view of my graph while having the scoring bar up. Now we need to set the exit point so the program can set the performance window. To do this click the “Tools” button and select “Exit”. Then click roughly where you exited the aircraft, which will be a steep drop off on the black line on the graph. If zoomed in properly to your flight, it will look like the drop off labeled in the images above. By setting your exit, the scores will be generated automatically.
Always More To Learn!
That’s a basic run through of your FlySight and the information it will provide you. I would like to point out that this article barely begins to scratch the surface of ways to use the FlySight, configuration, and information review. There is a whole lot more to learn and information to be had! For more information or to dive deeper into any specific part of this topic, feel free to contact me or any Lightning Flight coach and we will be happy to help you.